October 25, 2012

k-means clustering part 2


Introduction

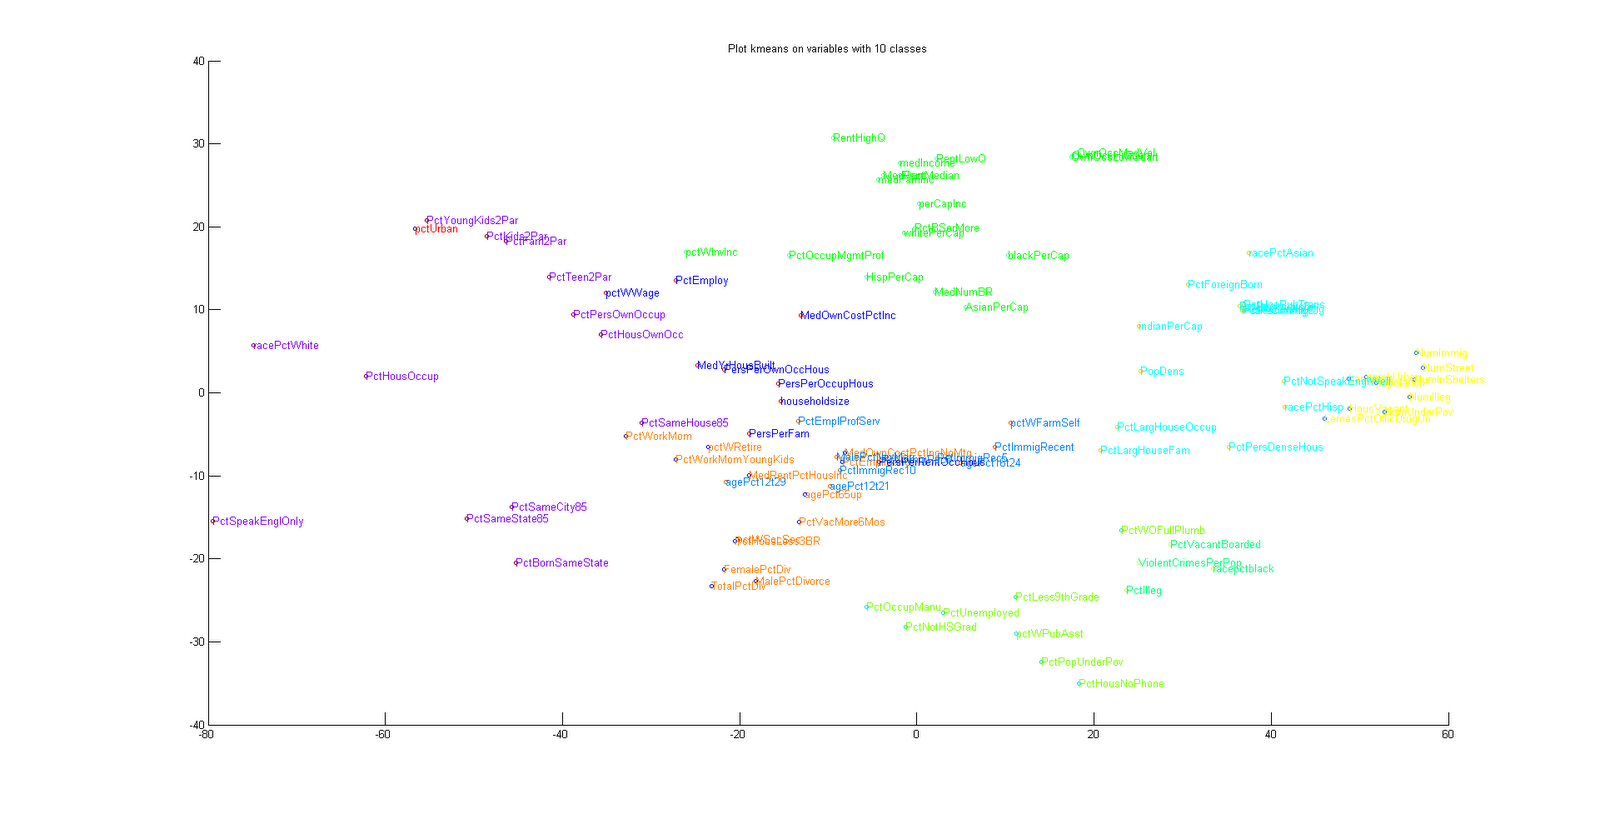
The must appropriate selection on variables is the cluster of five elements.
This grouping offers the particularity to give the same number of cluster than the agglomerative classification method.

The first group

PctForeignBorn,PctHousNoPhone,PctIlleg,PctLargHouseFam,PctLargHouseOccup,PctLess9thGrade,PctNotSpeakEnglWell,PctPersDenseHous,PctPopUnderPov,PctRecentImmig,PctRecImmig10,PctRecImmig5,PctRecImmig8,PctVacantBoarded,PctWOFullPlumb,pctWPubAsst,PopDens,racepctblack,racePctHisp,ViolentCrimesPerPop

The first group is composed by immigrant or illegitime children, living in large house not really graduate , not speaking english, under poverty, with public assistance, on a dense area. This group is near our targeted value.
Black and hispanic

The second group

HousVacant,indianPerCap,LandArea,LemasPctOfficDrugUn,numbUrban,NumIlleg,NumImmig,NumInShelters,NumStreet,NumUnderPov,PctUsePubTrans,population,racePctAsian
The group of workers whose use public transport under poverty with drug problems.
Asian and indian

The third group

AsianPerCap,blackPerCap,HispPerCap,medFamInc,medIncome,MedNumBR,MedRent,OwnOccHiQuart,OwnOccLowQuart,OwnOccMedVal,PctBSorMore,PctOccupMgmtProf,perCapInc,RentHighQ,RentLowQ,RentMedian,whitePerCap
The group of medium people from different race.

The fourth group

agePct12t21,agePct12t29,agePct16t24,agePct65up,FemalePctDiv,householdsize,MalePctDivorce,MalePctNevMarr,MedOwnCostPctInc,MedOwnCostPctIncNoMtg,MedRentPctHousInc,MedYrHousBuilt,PctEmplManu,PctEmplProfServ,PctHousLess3BR,PctImmigRec10,PctImmigRec5,PctImmigRec8,PctImmigRecent,PctNotHSGrad,PctOccupManu,PctUnemployed,PctVacMore6Mos,pctWFarmSelf,PctWorkMom,PctWorkMomYoungKids,pctWRetire,pctWSocSec,PersPerFam,PersPerOccupHous,PersPerOwnOccHous,PersPerRentOccHous,TotalPctDiv
The group of worker manual, immigrant , unemployed, with a big family , in a dense house and area.

The fifth group

PctBornSameState,PctEmploy,PctFam2Par,PctHousOccup,PctHousOwnOcc,PctKids2Par,PctPersOwnOccup,PctSameCity85,PctSameHouse85,PctSameState85,PctSpeakEnglOnly,PctTeen2Par,pctUrban,pctWInvInc,pctWWage,PctYoungKids2Par,racePctWhite
The perfect group , white and living on the same area, speaking in english with two kids, urban.
The white race disturb the idea of this group.


k-means clustering

K mean a metric approach

The approach is to use the k mean methodology to extract cluster  .This metric method permit to choose the number of cluster desired. In our best idea is to use 5 clusters. But to test and analysis , I have selected two to ten classes to verify this first hypothesis and to compare with other results.
The analysis is on individuals and variables.
As previously studied , the individuals analysis is really concentrated on the PCA view . And it s really difficult to have a real data separability. 
The variables clustering is really more interesting. Offering better views. The 5 classes is the most convenient visual choice and best separability offer.

10 clusters

2 clusters

3 clusters

4 clusters

5 clusters

6 clusters

7 clusters


8 clusters

10 clusters

2 clusters

3 clusters

4 clusters

5 clusters

6 clusters

7 clusters

8 clusters

9 clusters

October 24, 2012

Density based clustering

Introduction 

An other interesting approach is based on the density clustering. This approach based on the DBScan algorithm permit to mecanically extract some cluster on a metric analysis approach.
This algorithm offers more fragmented group that other methods.

Graphics

This is the graphical result obtained  Centered in the scrum.


The first group

HousVacant,LandArea,LemasPctOfficDrugUn,numbUrban,NumIlleg,NumImmig,NumInShelters,NumStreet,NumUnderPov,population
This first group correspond on a group of extreme values as Poverty, population, number of streets, shelters, illegitime children, urban, officer on drug unit, size of the land and house vacant.
Fire on different type of data that not permit to distinguish a group of people.

The second group

indianPerCap,MedNumBR,MedOwnCostPctInc,PctHousOccup,PctSpeakEnglOnly,pctUrban,PctUsePubTrans,pctWFarmSelf,pctWInvInc,racePctAsian,racePctWhite
This is an interesting group composed by indian,asian and white race. This group speak english is urban and /or self farm,use public transport, median owners cost and number of bedrooms. 

The third group

PctForeignBorn,PctRecentImmig,PctRecImmig10,PctRecImmig5,PctRecImmig8
This is a group of immigrant.

The fourth group

PctLargHouseFam,PctLargHouseOccup,PopDens
The group of population density with large house.

The fifth group

PctHousOwnOcc,PctPersOwnOccup
A group of owner of their house.

The sixth group

OwnOccHiQuart,OwnOccLowQuart,OwnOccMedVal
A group of owner occupied housing in lown high and medium quantile.

The seventh group

MedRent,RentHighQ,RentLowQ,RentMedian
A group of rental housing.

The heighth group

PctBornSameState,PctSameCity85,PctSameState85
People living on the same area.

The ninth group

agePct12t21,agePct12t29,agePct16t24,agePct65up,FemalePctDiv,householdsize,MalePctDivorce,MalePctNevMarr,MedOwnCostPctIncNoMtg,MedRentPctHousInc,MedYrHousBuilt,PctEmplManu,PctEmploy,PctEmplProfServ,PctHousLess3BR,PctImmigRec10,PctImmigRec5,PctImmigRec8,PctImmigRecent,PctVacMore6Mos,pctWSocSec,pctWWage,PersPerFam,PersPerOccupHous,PersPerOwnOccHous,PersPerRentOccHous,TotalPctDiv
A family group representation by age, employment, imigrant, housing...
Not a really named group, just a short multicosal representation of the study.

The tenth group

PctIlleg,PctVacantBoarded,PctWOFullPlumb,racepctblack,ViolentCrimesPerPop
This group contains our prefered analyzed value the violent crime per population value.
Illegitime children, vacant boarded house , with house without complete plumbing facilities and black race are grouped around our value.
An very concentrated cause of the value.

The eleventh group

PctNotSpeakEnglWell,PctPersDenseHous,racePctHisp
This group represents hispanic that not speak english living in dense house.

The twelfth group

HispPerCap,medFamInc,medIncome,PctBSorMore,PctOccupMgmtProf,perCapInc,whitePerCap
Goup of median family composed by white or hispanic , employed in management or professional occupations .

The thirteenth group

PctHousNoPhone,PctLess9thGrade,PctNotHSGrad,PctOccupManu,PctPopUnderPov,PctUnemployed,pctWPubAsst
The poverty people group
People without phone poorly graduate, manual employment, poverty or unemployed with public assistance.

The fourteenth group

PctSameHouse85,PctWorkMom,PctWorkMomYoungKids,pctWRetire
Living on the same house , where the mom works with young kids or retired.

The sixteenth group

AsianPerCap,blackPerCap
Asian and black group

The seventeenth group 

PctFam2Par,PctKids2Par,PctTeen2Par,PctYoungKids2Par
The Family and kids group


Hierarchical clustering on Variables Part 2


Short Introduction

After this study we can extract five interesting groups.
On this groups we discover some interesting values.
Immigrant are not the cause of the violent crimes and are really interested to work on the country.
The unemployement , the poverty and the graduations of people are really the most direct impact on the violent crimes. An other fact is that black people are really unemployed. A more interesting thing to do if we imagine one day to decrease the violent criminality is to offer more jobs for black race as in south affrica.

First Group

PctHousNoPhone,PctIlleg,PctLess9thGrade,PctNotHSGrad,PctOccupManu,PctPopUnderPov,PctUnemployed,PctVacantBoarded,PctWOFullPlumb,pctWPubAsst,racepctblack,ViolentCrimesPerPop
We can note that this group is corresponding on poor people living without phone , not graduate, under poverty, unemployed or manual employment, with public assistance and in a city where a great part of house area vacant and boarded. A hard life environment.

Second Group

agePct12t21,agePct12t29,agePct16t24,agePct65up,FemalePctDiv,householdsize,MalePctDivorce,MalePctNevMarr,MedOwnCostPctInc,MedOwnCostPctIncNoMtg,MedRentPctHousInc,MedYrHousBuilt,PctEmplManu,PctEmplProfServ,PctHousLess3BR,PctImmigRec10,PctImmigRec5,PctImmigRec8,,,PctImmigRecent,PctSameHouse85,PctVacMore6Mos,PctWorkMom,PctWorkMomYoungKids,pctWRetire,pctWSocSec,PersPerFam,PersPerOccupHous,PersPerOwnOccHous,PersPerRentOccHous,TotalPctDiv
Correponding to big family and immigrants whose living in renting their house  , with unstability on mariage . Where the mom works.

Third Group

AsianPerCap,blackPerCap,HispPerCap,indianPerCap,medFamInc,medIncome,MedNumBR,MedRent,OwnOccHiQuart,OwnOccLowQuart,OwnOccMedVal,PctBSorMore,PctOccupMgmtProf,pctWFarmSelf,perCapInc,RentHighQ,RentLowQ,RentMedian,whitePerCap
Corresponding to a group of different ethny, renting , owner of their house . A stable situation.

Fourth Group

PctBornSameState,PctEmploy,PctFam2Par,PctHousOccup,PctHousOwnOcc,PctKids2Par,PctPersOwnOccup,PctSameCity85,PctSameState85,PctSpeakEnglOnly,PctTeen2Par,pctUrban,pctWInvInc,pctWWage,PctYoungKids2Par,racePctWhite
This group correspond to the perfect idea of a family: two childs, living on the same city/state, speaking in english, white race, owner of their house.

Fifth Group

HousVacant,LandArea,LemasPctOfficDrugUn,numbUrban,NumIlleg,NumImmig,NumInShelters,NumStreet,NumUnderPov,PctForeignBorn,PctLargHouseFam,PctLargHouseOccup,PctNotSpeakEnglWell,PctPersDenseHous,PctRecentImmig,PctRecImmig10,PctRecImmig5,PctRecImmig8,PctUsePubTrans,PopDens,population,racePctAsian,racePctHisp
Corresponding to a group with immigrant(Asian Hisp ...) living on density environment using public transport and not speaking english.


October 23, 2012

Hierarchical clustering on Variablles

The study of variables follow our last study on the variables of our Principal Component Analysis. It was the first real interesting result in searching the understanding of our data. 
The actual case of the hierarchical agglomeration clustering offers, for the variables point of view, this dendrogram :


This dendogram gives an interesting that the best interesting point or number of classes is 5. Because this is the bigger jump on the dendograme that indicate the better force on the grouping possibility.
For the knowledge of this dendrogram and to understand this information , I give all the graphical result from 2 classes to 10 classes.
We can see that the better graphical choice is Five. With a good balance between classes, this is the appropriated choice.


Two classes
Three classes
Four classes
Five classes

Six classes


Seven classes

Height Classes

Nine Classes

Ten classes

October 22, 2012

Hierarchical clustering on Individuals


The data classification is an important thing to extract some interesting information. The internal structure of ur data set is really complex. If we arrive to extract some templates or some forms in our information, we can create some usable groups and study independently each group.
In this study there are a lot of classical methods as k-means, Hierarchical clustering and Self Organized Map.

We start with the Hierarchical clustering analysis on individuals
In this analysis we group data or data group by distance one by one. After a certain time, a result can be extracted easily  And two notices are usable: searching the best jump or by selecting manually a number of classes.
The result of this classification is this screen.


In this result we can see a Hierarchical clustering structure that permir to estimate a minimum four classes.
The results colored in a two first axes Principal Component Analysis is:


October 19, 2012

Discriminant analysis

After the first previous results on Principal Component Analysis . I propose a Discriminant Analysis to try to obtain a better grouping description.

This method could, based on the fact that group or class exists, to propose a better data definition, specification and understanding.

The discriminant analysis method is :
The data to study are:

the target of the discriminant analysis est to study the linear projection

in maximizing the difference between variables.
Where Sw is the Intra class and Sb the Inter Class.

The result on first two axes is:


We discover a result where the data are grouped on one area. No classes appear. It s reaaly not better than the PCA study.


October 5, 2012

Three first axes of our PCA: Variables Point of View

Circle Correlation analysis extracted from the Principal Component analysis.

The circles griven from our last analysis permit to see the structure or our variables. on the contrary of our individuals analysis we cans see that some groups can be explained easily.

This kind of information permit to extract some groups and give some information to treat different variables as a group and not individually.

The first two axes we can see it in this figure:


Group enumeration and description
  •  PctSpeakEnglOnly : this is an unique element in this class. Apparently the comportment of people whose talking English is independent from the rest of the variables.
  • racePctWhite  ,PctPersOwnOccup ,MedNumBR and  PctHouseOwnOccup compose a class that describes the race white, the owned occupation of the house and the median number of bedrooms. The last element is interesting because in grouping this value with the others we can conclude that the evolution of the number of bed is really connected to the percentage of white people in a community.
  • PctSameHouse85, PctWorkMom and PctWRetire combine the people whose leaving on the same house since 1985, have moms of kids under 18 in labor force and retired. Interesting , we describe a certain stability on the house.
  • PctBornSameState,pctWSocSec,agePct65up and PctVacMore6Mo describe the people whose born on the same state , with social security income, 65 and over in age and housing vacant more than 6 months. Clearly we describe a peaceful state where retired people born in the state live with social income with abandoned house.
  • PctSameState85,PctWorkMomYoungKids, PctSameCity85 and PctEmplManu group the people whose living in the same state, moms of kids 6 and under in labor force, living on the same city and manual employment. We describe a perfect industrial emplacement where people live near their work with moms working with young kids.
  • MedOwnCostPctInc, pctWFarmSelf and PctEmplProfServ describe the people whose are median owners cost as a percentage of household income with a mortgage, with farm or self employment income and employed in professional services. We can summarize in describing a farm with people employed near the farm and living in acceptable but difficult conditions. 
  • PctOccupManu,PctHousNoPhone, MalePctDivorce, TotalPctDiv, PctNotHSGrad, PctPopUnderPov, racepctblack, PctVacantBoarded, FemalePctDiv, PctLess9thGrade, PctUnemployed, pctWPubAsst, PctWOFullPlumb, PctHousLess3BR, PctIlleg and ViolentCrimesPerPop describe the people in social and economics difficulties. I can't describe totally each of this variables but each describe a particular and hard existence. Our variable to determine complete completely this view. We can see with a hard opinion that the social and economic level is really indicate the level of crimes. I don't know,if it s because we have a crime and poverty concentration, that the level of crimes are very important. But we can easily understood that to obtain a more low level crime in a country the most effect that a society can do is to furnish more services to this kind of people in terms of social help to obtain by example a free phone in the house or in adding more help to train and to direct people to new jobs. I can than in having amelioration in social relation we can obtain a better value. I don't talk about the race black because for me it's just a consequence of long social difficulties in US.
  • pctWInvInc,PctKids2Par,PctTeen2Par,PctFam2Par and PctYoungKids2Par correspond on people whose invest in household and having a young family with two kids and one less than 4 years. We understand a perfect family group searching some family stability who paying to loan their house
  • PctHouseOccup,HispPerCap and AsianPerCap appear sufficiently independent to not be considered in a group. 
  • medFamInc,medIncome,perCapInc,PctOccuptMgmtProf,PctEmploy,PctBSorMore,blackPerCap and white per cap describe median family whose working , having higher education and having a good income. This is a perfect family . We can see that black and white are represented in this family. This group is at the opposite of the our variable to predict( the violent crimes). Some stability in social and economic life can reduce considerably the crimes , this is the result of this short study.
  • pctWWage is alone and not linked directly to an other variable
  • pctUrban is not considered in a group.
  • MedRent,RentMedian,RenLowQ,RentHighQ the renting people
  • OwnOccLowQuart, OwnOccHiQuart and OwnOccMedVal are considered on a group whose considering owner occupied housing on low,median and high quartile. 
  • PctUsePubTrans,PersPerOwnOccHous,PersPerOccupHous and householdsize corresponding to people using public transport with a strong house occupation and size. The Big family.
  • MedOwnCostPctInc and racePctAsian correspond to asian whose leaving in a house with mortgage.
  • PersPerFam,PopDens and NumImmig correspond to the immigration and population density. 
  • PctForreignBorn,PctRecentImmig,PctRecImmig5,PctRecImmig8 and PctRecImmig10. Correspond to immigrant from all generation and not born in US
Second and third axes conform on this description


Three first axes of our PCA: Individuals Point of View


 From the Principal Component Analysis, Our two first axes are represented here:
We can see a big picture containing all of our data. We can see a grouping status. The colors correspond to classification following a k-mean classification. But the result appears to mix classes.
We cans see the second and third axes with the same colorization . But the result is not enough clear
We can think that the result is an amalgam of complex variables.
The difficult to study groups is evident . As the correlation between our individual data we can see particulars group in our study. All the data are evolving following the same "rules" .

October 4, 2012

Variables Reduction

For reduce the dimension of our studies , I will use a Principal Component Analysis. Normally this method permits to decrease considerably the number of variables in changing the dimensions. In clear the dimensions discovered give new and compacted variables and are not the same as compared with our first values. The new axes represent a part of most than one variable.
This new dimension can be used in a Perceptron to restrict to the most important variables our study and at the same time to reduce the time to calculate, to test and to validate a model.

The first thing to do , to understand this task, is to see the compression level of each of our axes.

The figure give this information:


We represent the inertia of the compression representation of our variables.
We can see that 20 first axes permit to cover more than 85% of our variables.
The three first axes give more than 50% of variables representation.

October 3, 2012

Correlation values with the value to predict

Correlation values with the value to predict


This is the list between our value to predict (the number of violent crimes in USA).
Variable Correlation Variable Correlation Variable Correlation
PctIlleg 0.738 PctRecImmig10 0.2643 PersPerOwnOccHous -0.1244
racepctblack 0.6313 PctRecImmig8 0.2532 PctWorkMom -0.1506
pctWPubAsst 0.5747 PersPerRentOccHous 0.2483 pctWFarmSelf -0.1531
FemalePctDiv 0.556 PctImmigRec8 0.2481 PctSameHouse85 -0.1554
TotalPctDiv 0.5528 PctRecImmig5 0.248 AsianPerCap -0.1556
MalePctDivorce 0.5254 PctRecentImmig 0.2308 OwnOccHiQuart -0.1721
PctPopUnderPov 0.5219 PctImmigRec5 0.216 OwnOccMedVal -0.1907
PctUnemployed 0.5042 LandArea 0.1968 whitePerCap -0.2093
PctHousNoPhone 0.4882 PctForeignBorn 0.1944 OwnOccLowQuart -0.2105
PctNotHSGrad 0.4834 PctImmigRecent 0.1719 RentHighQ -0.2323
PctVacantBoarded 0.4828 PctUsePubTrans 0.1538 MedRent -0.2399
PctHousLess3BR 0.4745 agePct12t29 0.1534 RentMedian -0.2405
NumIlleg 0.471 PersPerFam 0.1407 PctSpeakEnglOnly -0.2415
PctPersDenseHous 0.4529 pctWSocSec 0.18 HispPerCap -0.2446
NumUnderPov 0.4476 agePct16t24 0.0993 RentLowQ -0.2518
HousVacant 0.4214 pctUrban 0.082 blackPerCap -0.2754
PctLess9thGrade 0.4111 PctSameCity85 0.0756 pctWWage -0.3055
PctLargHouseFam 0.3835 agePct65up 0.0672 PctBSorMore -0.3147
NumInShelters 0.3758 MedOwnCostPctInc 0.0638 PctHousOccup -0.319
population 0.3672 agePct12t21 0.0605 PctEmploy -0.3316
PctWOFullPlumb 0.3645 MedOwnCostPctIncNoMtg 0.0538 PctOccupMgmtProf -0.3391
numbUrban 0.3629 racePctAsian 0.0376 perCapInc -0.3521
LemasPctOfficDrugUn 0.3486 PctVacMore6Mos 0.0213 MedNumBR -0.3574
NumStreet 0.3403 PctSameState85 -0.0195 medIncome -0.4242
MedRentPctHousInc 0.325 PctWorkMomYoungKids -0.0225 medFamInc -0.4391
MalePctNevMarr 0.3046 householdsize -0.0349 PctHousOwnOcc -0.4707
PctNotSpeakEnglWell 0.3 PersPerOccupHous -0.0397 PctPersOwnOccup -0.5255
PctOccupManu 0.2956 PctEmplManu -0.0449 pctWInvInc -0.5763
PctLargHouseOccup 0.2948 PctEmplProfServ -0.0715 PctTeen2Par -0.6616
NumImmig 0.2942 PctBornSameState -0.0772 PctYoungKids2Par -0.6661
racePctHisp 0.2931 indianPerCap -0.0909 racePctWhite -0.6848
PctImmigRec10 0.2915 pctWRetire -0.0984 PctFam2Par -0.7067
PopDens 0.2814 MedYrHousBuilt -0.11 PctKids2Par -0.7384
So, we can see the most correlated values on this page. PctIlleg (percentage of kids born to never married) and racepctblack ( percentage of population that is african american) are very correlated with our value to estimate. I'm french and in my point of view the race has no interest. For me, it's not the race but the fact that people can live in poor area with more public assistance as the next correlated value named pctWPubAsst.
At the inverse , we cans see the racePctWhite (percentage of population that is caucasian), PctFam2Par (ercentage of families (with kids) that are headed by two parents) and PctKids2Par (percentage of kids in family housing with two parents) completing the fact that a stable family (strangely white by the race) is a decisive information to not have violent crimes on the area.

pctUrban is poorly correlated with our value. The fact of be in an urban area or not is not decisive to estimate our value.
PctSameState85 (percent of people living in the same state as in 1985 (5 years before)) and PctVacMore6Mos  (percent of vacant housing that has been vacant more than 6 months) have not an important effect in our future estimation.

I think that you can continue to verify by yourself this important list of comparison by yourself.

I hope to give the most important facts or summary of these values.

The most important in my first feeling is to say a stable and an unstable family and social area should be an important cause of the number of violent crimes. This is really important, because it proves that a politic based on security purchase or based on non management of the unemployment or social priorities could not have a direct effect on the violent crimes existence. At the inverse , in stabilizing the social family an context with a complex social politic should permit to decrease considerably the violent crimes.