Short intro
I want to present the final elements resulting of the review of the variables of my study on violent crimes.
Why grouping variables ? It is a good question but we need to know how variables interact and coexist . At the same time their understanding permit to implement some strategy on research as vectorization or map reducing.
When I have started my study I haven't searched to define group of people. But the study has moving me to identify some humans group. When I say humans group , I want to talk about social relationship.
It s really a surprise for me to distinguish clearly social and cultural group.
I let you discover my final analysis.
Results
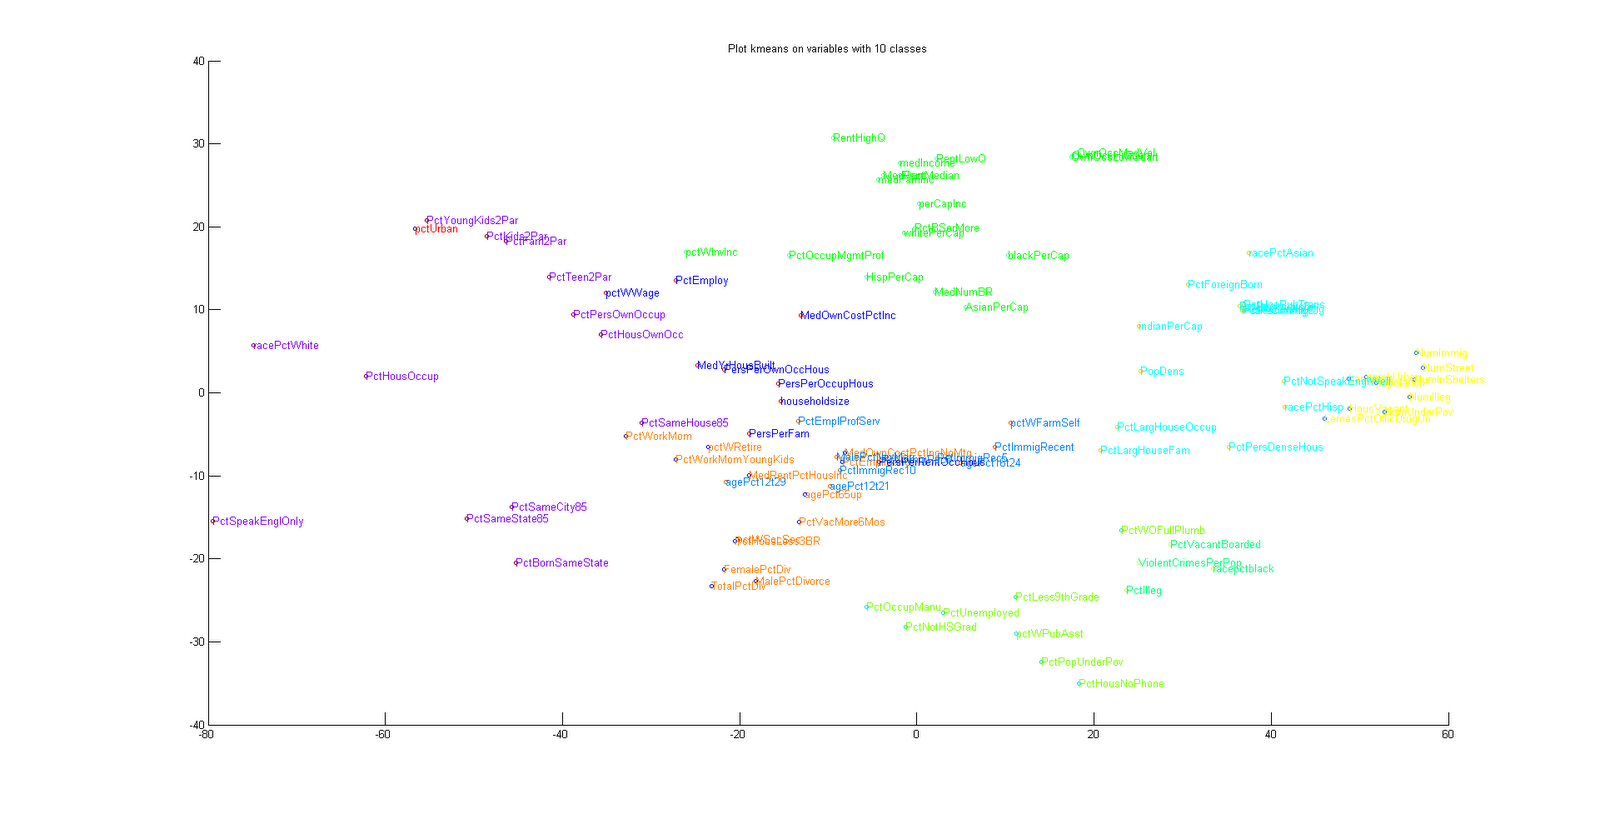
The first group : grouped around the violent crime per 100k hab variable
HousVacant, LandArea, LemasPctOfficDrugUn, numbUrban ,NumIlleg ,NumImmig, NumInShelters, NumStreet, NumUnderPov, PctForreignBorn, PctHousNoPhone ,PctIlleg, PctLargHouseFam, PctLargHouseOccup, PctLess9thGrade , PctNotSpeakEnglWell , PctPersDenseHous, PctPopUnderPov ,PctRecentImmig ,PctRecImmig10,PctRecImmig5,PctRecImmig8, PctVacantBoarded , PctWOFullPlumb , pctWPubAsst , PopDens ,population , racepctblack ,racePctHisp , ViolentCrimesPerPop.
I know that the readability of this group is not easy. But I can give some information.
This group is a group of people living in an area where house are vacant and/or boarded, really urban and very dense, with illegitime children, immigrant, where people don t have a phone, living in large house with public assistance and not graduate. Black and hispanic race.
We have all the principal values around the violent criminality. Reducing one of this factor can have a real impact on crime activity.
The second group : the poor workers
agePct12t21
,agePct12t29
,agePct16t24
,agePct65up, FemalePctDiv, householdsize, indianPerCap, MalePctDivorce
, MalePctNevMar , MedOwnCostPctInc
,MedOwnCostPctIncNoMtg
, MedRentPctHousInc
,MedYrHousBuilt
, PctEmplManu, PctEmplProfServ, PctHousLess3BR, PctImmigRec10
,PctImmigRec5
,PctImmigRec8
,PctImmigRecent
, PctNotHSGrad, PctOccupManu, PctUnemployed, PctUsePubTrans, PctVacMore6Mo
, pctWFarmSelf
, pctWSocSec, PersPerFam
,PersPerOccupHous
,PersPerOwnOccHous
,PersPerRentOccHous
, racePctAsian, TotalPctDiv
This group correspond to the mean of the population that use public transport, have manual work or unemployed , without social security, immigrant , without diploma. Indian and Asian are represented.
The third group : the managers
AsianPerCap ,blackPerCap, HispPerCap, medFamInc ,medIncome ,MedNumBR , MedRent, OwnOccHiQuart ,OwnOccLowQuart, OwnOccMedVal , PctBSorMore, PctOccuptMgmtProf, perCapInc, RenLowQ,RentHighQ,RentMedian, white per cap
This group is interesting, because we mix some race as white, black , asian and hispanic . An this group is composed by managers whose living in their proper house or renting it. We can say that this group manage the second group.
The fourth group : the ideal family
PctBornSameState, PctEmploy, PctFam2Par, PctKids2Par, PctSameCity85 ,PctSameHouse85,PctSameState85,PctSpeakEnglOnly,PctTeen2Par , pctUrban, pctWInvInc, PctWorkMom,PctWorkMomYoungKids , PctWRetire, pctWWage ,PctYoungKids2Par , racePctWhite , PctHouseOccup ,PctHouseOwnOccup , PctPersOwnOccup
This incredible group is a perfect family as we can see in the idealiste literature.
With two kids, living in the same area since a long time , speaking in english , working or retired and not unemployed and white race.
Stability of the group on their area permit the employment and the tv dict some idea as two children by family, ...