Showing posts with label Data mining. Show all posts

December 30, 2012

Four groups: a visual point of view


I follow the study written on the message the groups of my study article

We start with the first screen that colorize my first group explained. This first group describes the most hard and poor people where we found violent crime problems. 
We can see that the value is shared on the entire map. Certain states are more represented as California  New York, Michigan, Delaware and Kansas

Group around the violent criminality 

The fourth group the group of the ideal family , white with two children ,..  This perfect group is shared along the united states of america. More representative states are based on the north . Where the south is more sweet.

The group of the ideal family

 The group of workers. We found this group in all the state with an equal representation.

The group of poor workers

The group of manager is really interesting. because the structure of this group is really important in California , New Jersey, Connecticut and Massachusetts . Idaho is lowest represented as Kentucky , Louisiana, ...

The group of the managers 


Predict and model estimation

Short summary

For study and to estimate a good model we need a scientific approach in segment values to construct the model and values to tes the model.
For certain method as neural network , we need to add some validation values to stop and find the stability of the engine.

Our exercise is to try to extract from the existing data , a stable model to predict the value of the violent crimes for 100k habitant .The typology of the violent crimes is large each county communities and countries have their proper approach. We can include murders, sexual acts, ...
More approach is considered on my study by regression , SVM and neural network.


The values segmentation

The data are cut as this:

  • 1094 values for the model estimation
  • 401 values for the validation of the model
  • 101 values to verify and test the precision of the model


The first strategies

The data are really hard to be separated , it s why in ours strategies the classification could be short.

The first analysis should permit to estimate models in a classical manner.
A first good point to compare with strategy of data reduction.
A second analysis should cut the data in more than 2 classes and models. Yes , to have a more accuracy estimation we can cut our model and use a SVM for automatic classification on new values.
A third approach is to remove unnecessary data as extrema or non connected individuals or variables.
The last study should mix these strategies.    

November 9, 2012

Histogram

Introduction

The values are centered and reduced. We need to analyse their distribution for a futur analysis based on a semi parametric statistic approach. On this case , I give all the distribution for all the variables.
Sometimes values are difficult to identify and two methods (mlc and em) are used to identify their distribution.
We can see by example that the more representative population of each community are based on low population number. We can see that the white people representation are more represented in this study. Black, asian,hispanic are lowly represented in the study. 
We can see too than the urban people or illegitime children or not english speaking or immigrant or poverty are poorly represented. While their impact are really important in the violent crimes factor.


November 8, 2012

SOM on individuals with vote

Introduction 

Some of the individuals are difficult to identify but in exercising your eyes you should see a short code identifier of the state and the community name . With more than 1800 individuals , it s difficult to identify individual data. The method choose is the vote. The most representative of the area is represented on the view. More is white , more the group is large. More is blue , more it s desert.
The color is compared as an isle map.  I use the sdh tools to generate this map.

SOM classification on variables

Introduction

I use the SOM toolbox to extract my classification . It is a kohonen approach on Self Map Organisation.
It is a puissant tool to classify the metric data. Near a neural network method, the algorithm construct at each step a map reorganized to fit the best grouping on the selected map element (columns and rows).

This approach reveal than races are not an essential reference to classify the variables.

A Map of 6x6

This map is really well balanced. 
On top left, we concentrate median people.
On top right, we concentrate nice people (white, speaking english ,...)
On bottom left , we concentrate immigrant and population density
On bottom right, we concentrate immigrant and social.
On bottom middle our value to predict the violent crime.

It is a good map. Each variable found a perfect place. 

A Map of 2x2

I have reduced the map to a 2x2 to obtain more grouped variables. It s not innocent . It s because I need some opposable variables to our predict value for filter data in prediction research. You will see this feature in the next message.
Now on this map:
On the top left we have immigrant , illegitime,density, urban,poverty and our targeted variable to predict.
On the top right we have immigrant , manual employment,social,education.
On the bottom left  we have medium family.
On the bottom right  we found the ideal family speaking english with 2 children, living on the same area. The opposite of the violent crime


October 25, 2012

k-means clustering part 2


Introduction

The must appropriate selection on variables is the cluster of five elements.
This grouping offers the particularity to give the same number of cluster than the agglomerative classification method.

The first group

PctForeignBorn,PctHousNoPhone,PctIlleg,PctLargHouseFam,PctLargHouseOccup,PctLess9thGrade,PctNotSpeakEnglWell,PctPersDenseHous,PctPopUnderPov,PctRecentImmig,PctRecImmig10,PctRecImmig5,PctRecImmig8,PctVacantBoarded,PctWOFullPlumb,pctWPubAsst,PopDens,racepctblack,racePctHisp,ViolentCrimesPerPop

The first group is composed by immigrant or illegitime children, living in large house not really graduate , not speaking english, under poverty, with public assistance, on a dense area. This group is near our targeted value.
Black and hispanic

The second group

HousVacant,indianPerCap,LandArea,LemasPctOfficDrugUn,numbUrban,NumIlleg,NumImmig,NumInShelters,NumStreet,NumUnderPov,PctUsePubTrans,population,racePctAsian
The group of workers whose use public transport under poverty with drug problems.
Asian and indian

The third group

AsianPerCap,blackPerCap,HispPerCap,medFamInc,medIncome,MedNumBR,MedRent,OwnOccHiQuart,OwnOccLowQuart,OwnOccMedVal,PctBSorMore,PctOccupMgmtProf,perCapInc,RentHighQ,RentLowQ,RentMedian,whitePerCap
The group of medium people from different race.

The fourth group

agePct12t21,agePct12t29,agePct16t24,agePct65up,FemalePctDiv,householdsize,MalePctDivorce,MalePctNevMarr,MedOwnCostPctInc,MedOwnCostPctIncNoMtg,MedRentPctHousInc,MedYrHousBuilt,PctEmplManu,PctEmplProfServ,PctHousLess3BR,PctImmigRec10,PctImmigRec5,PctImmigRec8,PctImmigRecent,PctNotHSGrad,PctOccupManu,PctUnemployed,PctVacMore6Mos,pctWFarmSelf,PctWorkMom,PctWorkMomYoungKids,pctWRetire,pctWSocSec,PersPerFam,PersPerOccupHous,PersPerOwnOccHous,PersPerRentOccHous,TotalPctDiv
The group of worker manual, immigrant , unemployed, with a big family , in a dense house and area.

The fifth group

PctBornSameState,PctEmploy,PctFam2Par,PctHousOccup,PctHousOwnOcc,PctKids2Par,PctPersOwnOccup,PctSameCity85,PctSameHouse85,PctSameState85,PctSpeakEnglOnly,PctTeen2Par,pctUrban,pctWInvInc,pctWWage,PctYoungKids2Par,racePctWhite
The perfect group , white and living on the same area, speaking in english with two kids, urban.
The white race disturb the idea of this group.


k-means clustering

K mean a metric approach

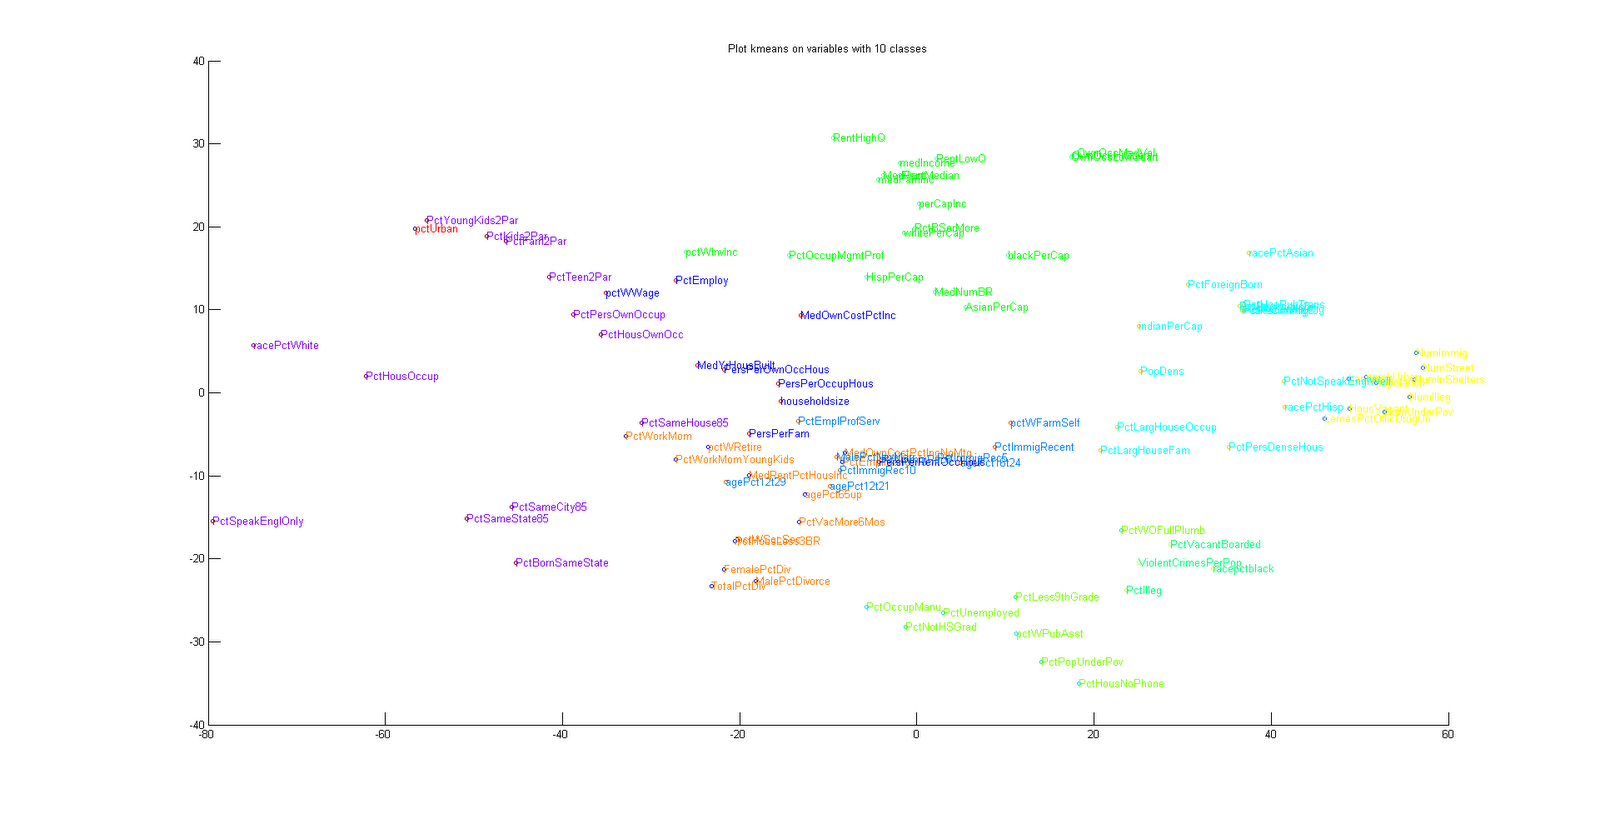
The approach is to use the k mean methodology to extract cluster  .This metric method permit to choose the number of cluster desired. In our best idea is to use 5 clusters. But to test and analysis , I have selected two to ten classes to verify this first hypothesis and to compare with other results.
The analysis is on individuals and variables.
As previously studied , the individuals analysis is really concentrated on the PCA view . And it s really difficult to have a real data separability. 
The variables clustering is really more interesting. Offering better views. The 5 classes is the most convenient visual choice and best separability offer.

10 clusters

2 clusters

3 clusters

4 clusters

5 clusters

6 clusters

7 clusters


8 clusters

10 clusters

2 clusters

3 clusters

4 clusters

5 clusters

6 clusters

7 clusters

8 clusters

9 clusters

October 24, 2012

Density based clustering

Introduction 

An other interesting approach is based on the density clustering. This approach based on the DBScan algorithm permit to mecanically extract some cluster on a metric analysis approach.
This algorithm offers more fragmented group that other methods.

Graphics

This is the graphical result obtained  Centered in the scrum.


The first group

HousVacant,LandArea,LemasPctOfficDrugUn,numbUrban,NumIlleg,NumImmig,NumInShelters,NumStreet,NumUnderPov,population
This first group correspond on a group of extreme values as Poverty, population, number of streets, shelters, illegitime children, urban, officer on drug unit, size of the land and house vacant.
Fire on different type of data that not permit to distinguish a group of people.

The second group

indianPerCap,MedNumBR,MedOwnCostPctInc,PctHousOccup,PctSpeakEnglOnly,pctUrban,PctUsePubTrans,pctWFarmSelf,pctWInvInc,racePctAsian,racePctWhite
This is an interesting group composed by indian,asian and white race. This group speak english is urban and /or self farm,use public transport, median owners cost and number of bedrooms. 

The third group

PctForeignBorn,PctRecentImmig,PctRecImmig10,PctRecImmig5,PctRecImmig8
This is a group of immigrant.

The fourth group

PctLargHouseFam,PctLargHouseOccup,PopDens
The group of population density with large house.

The fifth group

PctHousOwnOcc,PctPersOwnOccup
A group of owner of their house.

The sixth group

OwnOccHiQuart,OwnOccLowQuart,OwnOccMedVal
A group of owner occupied housing in lown high and medium quantile.

The seventh group

MedRent,RentHighQ,RentLowQ,RentMedian
A group of rental housing.

The heighth group

PctBornSameState,PctSameCity85,PctSameState85
People living on the same area.

The ninth group

agePct12t21,agePct12t29,agePct16t24,agePct65up,FemalePctDiv,householdsize,MalePctDivorce,MalePctNevMarr,MedOwnCostPctIncNoMtg,MedRentPctHousInc,MedYrHousBuilt,PctEmplManu,PctEmploy,PctEmplProfServ,PctHousLess3BR,PctImmigRec10,PctImmigRec5,PctImmigRec8,PctImmigRecent,PctVacMore6Mos,pctWSocSec,pctWWage,PersPerFam,PersPerOccupHous,PersPerOwnOccHous,PersPerRentOccHous,TotalPctDiv
A family group representation by age, employment, imigrant, housing...
Not a really named group, just a short multicosal representation of the study.

The tenth group

PctIlleg,PctVacantBoarded,PctWOFullPlumb,racepctblack,ViolentCrimesPerPop
This group contains our prefered analyzed value the violent crime per population value.
Illegitime children, vacant boarded house , with house without complete plumbing facilities and black race are grouped around our value.
An very concentrated cause of the value.

The eleventh group

PctNotSpeakEnglWell,PctPersDenseHous,racePctHisp
This group represents hispanic that not speak english living in dense house.

The twelfth group

HispPerCap,medFamInc,medIncome,PctBSorMore,PctOccupMgmtProf,perCapInc,whitePerCap
Goup of median family composed by white or hispanic , employed in management or professional occupations .

The thirteenth group

PctHousNoPhone,PctLess9thGrade,PctNotHSGrad,PctOccupManu,PctPopUnderPov,PctUnemployed,pctWPubAsst
The poverty people group
People without phone poorly graduate, manual employment, poverty or unemployed with public assistance.

The fourteenth group

PctSameHouse85,PctWorkMom,PctWorkMomYoungKids,pctWRetire
Living on the same house , where the mom works with young kids or retired.

The sixteenth group

AsianPerCap,blackPerCap
Asian and black group

The seventeenth group 

PctFam2Par,PctKids2Par,PctTeen2Par,PctYoungKids2Par
The Family and kids group


Hierarchical clustering on Variables Part 2


Short Introduction

After this study we can extract five interesting groups.
On this groups we discover some interesting values.
Immigrant are not the cause of the violent crimes and are really interested to work on the country.
The unemployement , the poverty and the graduations of people are really the most direct impact on the violent crimes. An other fact is that black people are really unemployed. A more interesting thing to do if we imagine one day to decrease the violent criminality is to offer more jobs for black race as in south affrica.

First Group

PctHousNoPhone,PctIlleg,PctLess9thGrade,PctNotHSGrad,PctOccupManu,PctPopUnderPov,PctUnemployed,PctVacantBoarded,PctWOFullPlumb,pctWPubAsst,racepctblack,ViolentCrimesPerPop
We can note that this group is corresponding on poor people living without phone , not graduate, under poverty, unemployed or manual employment, with public assistance and in a city where a great part of house area vacant and boarded. A hard life environment.

Second Group

agePct12t21,agePct12t29,agePct16t24,agePct65up,FemalePctDiv,householdsize,MalePctDivorce,MalePctNevMarr,MedOwnCostPctInc,MedOwnCostPctIncNoMtg,MedRentPctHousInc,MedYrHousBuilt,PctEmplManu,PctEmplProfServ,PctHousLess3BR,PctImmigRec10,PctImmigRec5,PctImmigRec8,,,PctImmigRecent,PctSameHouse85,PctVacMore6Mos,PctWorkMom,PctWorkMomYoungKids,pctWRetire,pctWSocSec,PersPerFam,PersPerOccupHous,PersPerOwnOccHous,PersPerRentOccHous,TotalPctDiv
Correponding to big family and immigrants whose living in renting their house  , with unstability on mariage . Where the mom works.

Third Group

AsianPerCap,blackPerCap,HispPerCap,indianPerCap,medFamInc,medIncome,MedNumBR,MedRent,OwnOccHiQuart,OwnOccLowQuart,OwnOccMedVal,PctBSorMore,PctOccupMgmtProf,pctWFarmSelf,perCapInc,RentHighQ,RentLowQ,RentMedian,whitePerCap
Corresponding to a group of different ethny, renting , owner of their house . A stable situation.

Fourth Group

PctBornSameState,PctEmploy,PctFam2Par,PctHousOccup,PctHousOwnOcc,PctKids2Par,PctPersOwnOccup,PctSameCity85,PctSameState85,PctSpeakEnglOnly,PctTeen2Par,pctUrban,pctWInvInc,pctWWage,PctYoungKids2Par,racePctWhite
This group correspond to the perfect idea of a family: two childs, living on the same city/state, speaking in english, white race, owner of their house.

Fifth Group

HousVacant,LandArea,LemasPctOfficDrugUn,numbUrban,NumIlleg,NumImmig,NumInShelters,NumStreet,NumUnderPov,PctForeignBorn,PctLargHouseFam,PctLargHouseOccup,PctNotSpeakEnglWell,PctPersDenseHous,PctRecentImmig,PctRecImmig10,PctRecImmig5,PctRecImmig8,PctUsePubTrans,PopDens,population,racePctAsian,racePctHisp
Corresponding to a group with immigrant(Asian Hisp ...) living on density environment using public transport and not speaking english.


October 23, 2012

Hierarchical clustering on Variablles

The study of variables follow our last study on the variables of our Principal Component Analysis. It was the first real interesting result in searching the understanding of our data. 
The actual case of the hierarchical agglomeration clustering offers, for the variables point of view, this dendrogram :


This dendogram gives an interesting that the best interesting point or number of classes is 5. Because this is the bigger jump on the dendograme that indicate the better force on the grouping possibility.
For the knowledge of this dendrogram and to understand this information , I give all the graphical result from 2 classes to 10 classes.
We can see that the better graphical choice is Five. With a good balance between classes, this is the appropriated choice.


Two classes
Three classes
Four classes
Five classes

Six classes


Seven classes

Height Classes

Nine Classes

Ten classes

October 22, 2012

Hierarchical clustering on Individuals


The data classification is an important thing to extract some interesting information. The internal structure of ur data set is really complex. If we arrive to extract some templates or some forms in our information, we can create some usable groups and study independently each group.
In this study there are a lot of classical methods as k-means, Hierarchical clustering and Self Organized Map.

We start with the Hierarchical clustering analysis on individuals
In this analysis we group data or data group by distance one by one. After a certain time, a result can be extracted easily  And two notices are usable: searching the best jump or by selecting manually a number of classes.
The result of this classification is this screen.


In this result we can see a Hierarchical clustering structure that permir to estimate a minimum four classes.
The results colored in a two first axes Principal Component Analysis is: